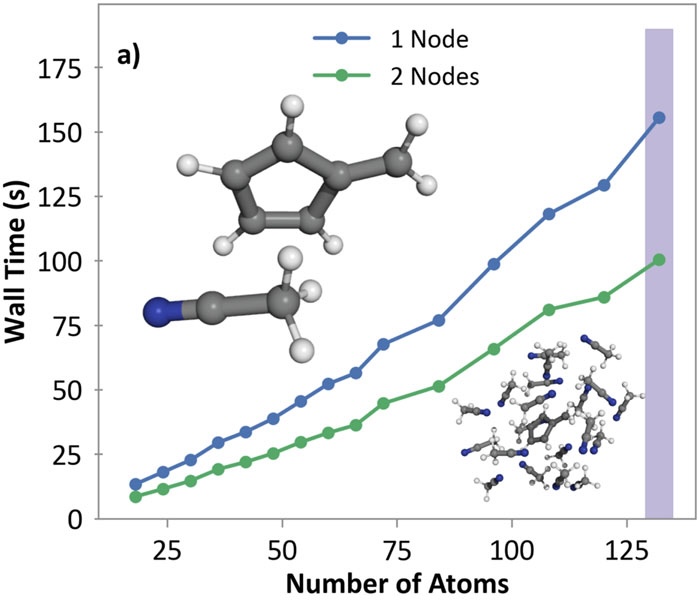
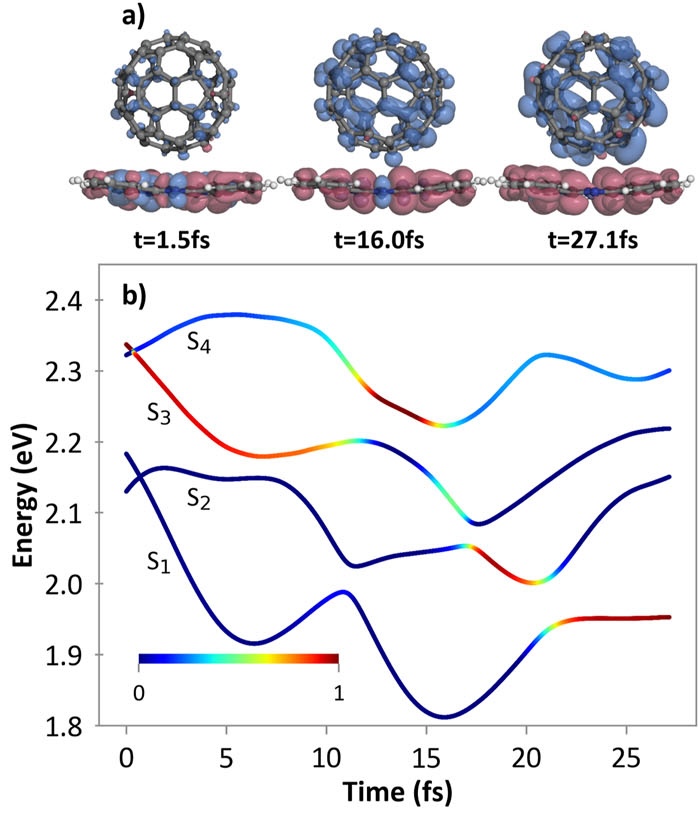
Linear scaling enables the simulation of not just the chromophore, but also the solvent around it
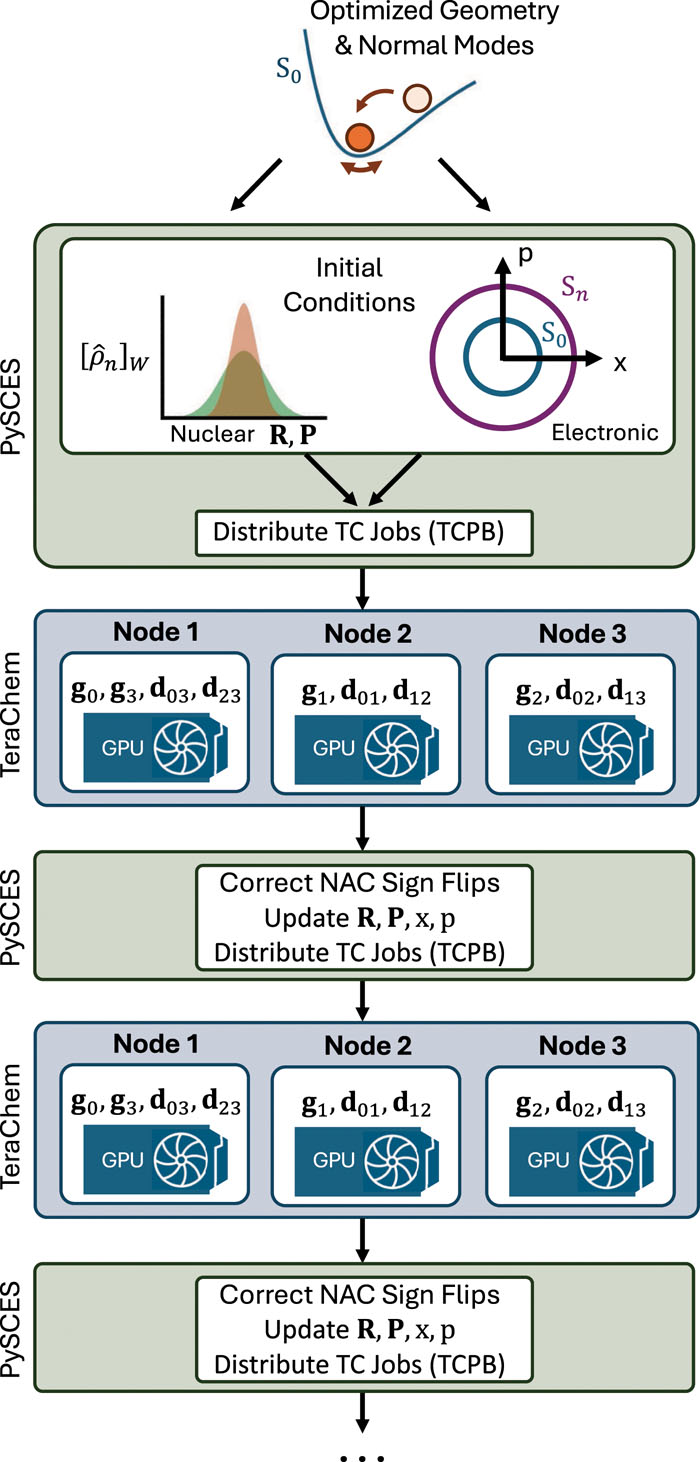
Protocol Buffers allow for efficient distribution of workloads across GPU compute nodes
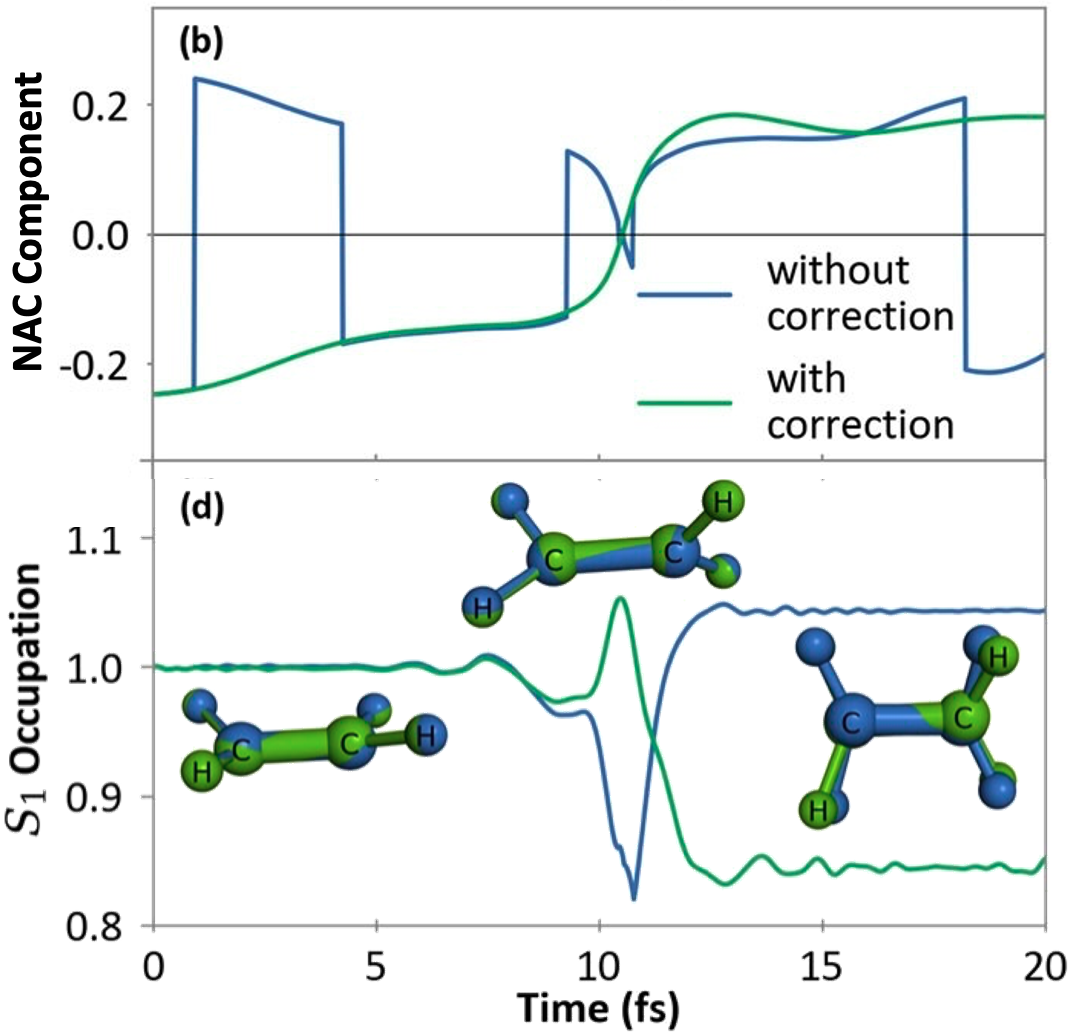
Interpolation/extrapolation techniques enable overlap-free corrections to linear algebra sign-flips
Semi-classical dynamics for 100+ atom systems
PySCES
Semi-Classical Dynamics with On-the-fly Electronic Structure
A nonadiabatic, semiclassics simulation software that interfaces with TeraChem and GAMESS quantum chemistry programs.
Article PDF | Publisher | GitHub Repo
This project also utilized the TeraChem Protobuffer Client to connect to GPU computing nodes.
Skills and Abilities: Distributed computing with Google Protobuffers and MPI, CUDA and GPU acceleration, and experience with large commercial codebases.